Aymara
Active Member
But the Performance Monitor in Logic only shows the amount of used cores, not what kind of cores are used, right?Using the Logic Performance Monitor tells the tale.
But the Performance Monitor in Logic only shows the amount of used cores, not what kind of cores are used, right?Using the Logic Performance Monitor tells the tale.
No - it shows the cores allocated to audio processing, not just those actually in use. Notice in my screenshots the cores are showing no activity (no plugins loaded) but the number of allocated cores/columns changes based on how I configure the audio settings - 6 columns vs 12 columns.But the Performance Monitor in Logic only shows the amount of used cores, not what kind of cores are used, right?
I believe you (i.e. the second sentence I quoted), but the Performance Monitor is showing processing threads, not CPU. There has to be a lot of correlation, but I don't think each thread is assigned to one core. Am I wrong?Using the Logic Performance Monitor tells the tale.
This was hashed out extensively back in 2020/2021 when the M1 stuff appeared.
You're not wrong: it's displaying threads rather than cores. Logic tells the OS that it's using those threads for real-time audio processing, though, so the OS is fairly likely to schedule them as if they're pinned to a performance core each - especially when fully loaded. I say "as if they're pinned" because many things can upset this plan: e.g. plugins/processes demanding realtime CPU without coordinating with Logic; or the OS withdrawing performance cores owing to overheating.the Performance Monitor is showing processing threads, not CPU. There has to be a lot of correlation, but I don't think each thread is assigned to one core. Am I wrong?
I don't know about Logic, but yes multiple threads can be run with a single CPU core.I believe you (i.e. the second sentence I quoted), but the Performance Monitor is showing processing threads, not CPU. There has to be a lot of correlation, but I don't think each thread is assigned to one core. Am I wrong?

The caption under the meter display - "Processing Threads" - is, I believe not literally meaning each column is a thread. Apple's own support document states "Processing Threads: Shows the amount of CPU and RAM processing power Logic Pro is using on the available cores in your Mac. Each core in your Mac has its own meter." (emphasis is mine).
https://support.apple.com/en-us/108295
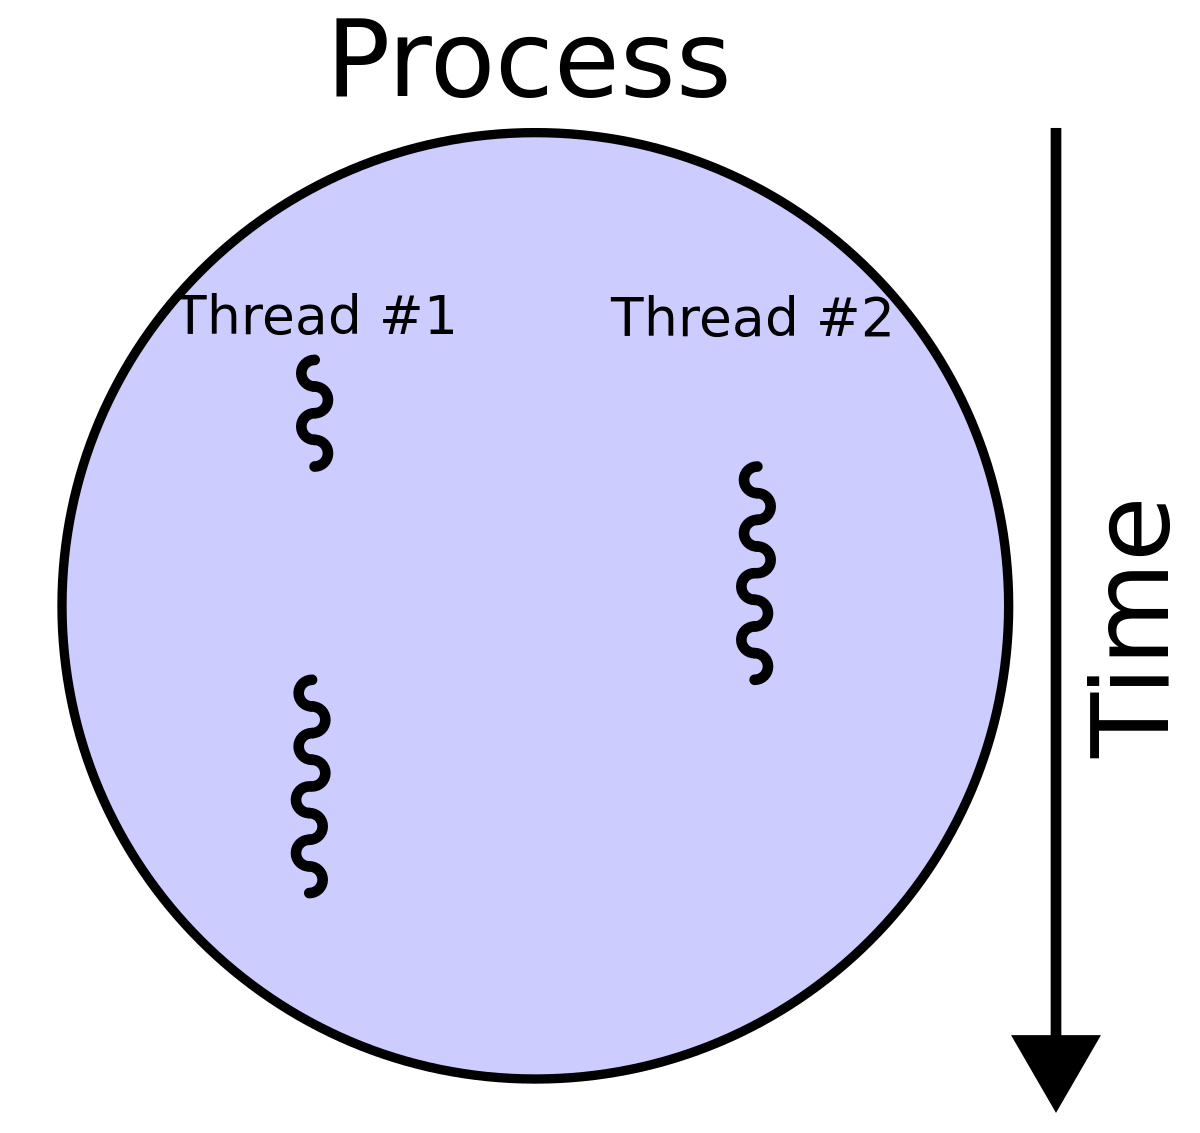
There should be a tool that monitors the OS and will show how many processes and threads are active for each application.I don't know about Logic, but yes multiple threads can be run with a single CPU core.

Multithreading (computer architecture) - Wikipedia
en.wikipedia.org
It's only displaying a bar for the top-level audio processing threads, even though there may be 100s of other (mostly idle) threads attached to the DAW. Logic's docs/captions use "thread" and "core" interchangeably in various places - plus a caveat for hyperthreading - but these meters are only very rough guide to performance. For those purposes, it's good enough to treat those N processing threads as equivalent to N cores.I don't believe the logic performance monitor is showing individual threads. There are way more than a handful of threads and as you say there is not a one to one relationship between threads and physical cores. The caption under the meter display - "Processing Threads" - is, I believe not literally meaning each column is a thread. Apple's own support document states "Processing Threads: Shows the amount of CPU and RAM processing power Logic Pro is using on the available cores in your Mac. Each core in your Mac has its own meter." (emphasis is mine).
https://support.apple.com/en-us/108295
There are many. 'htop' does a fairly good job, e.g.There should be a tool that monitors the OS and will show how many processes and threads are active for each application.
It clearly states that each meter (column) represents a core. Each meter shows the cumulative thread load on that core.A friend used to work on the Logic manual. I'll ask him whether he wrote that and whether the words are literal.
Yes, I did read your quote!It clearly states that each meter (column) represents a core. Each meter shows the cumulative thread load on that core.
Yes, that's been an important feature for a while.Also: "Logic running natively on AS runs AU plugins in separate processes to Logic itself - hence why you're seeing the HostingService entries. This is so if one plugin crashes, it shouldn't take the entire DAW with it."
Yes. As someone who has never used VSL VEPro – does this eliminate, to some degree, the need for using VEPro?Yes, that's been an important feature for a while.
The manual uses both "core" and "thread" in different places. Luckily, it hardly matters, since - and I can't emphasise this enough - the bar chart is a *very, very* rough approximation of reality. The number of bars in the meter does relate to cores in the machine, but only because Logic's UI uses the core counts to decide which settings to offer you. "Automatic" offers you 1 thread per P-core, and those will usually be run on the P-cores preferentially. "Maximum" offers you 1 thread/P- or E- core. Logic could offer even more threads and it'd still work; it chooses not to because performance would always be worse.It clearly states that each meter (column) represents a core. Each meter shows the cumulative thread load on that core.
So, with 12+4 cores, and 36 Logic threads + 175 cores assigned to "AUHosting Service (Logic Pro)", and mainly one thread per P-core: how is this distributed?"Automatic" offers you 1 thread per P-core, and those will usually be run on the P-cores preferentially.
That will be more or less shown in Activity Monitor's CPU History.how is this distributed?
Most of those threads will probably lie dormant for most of the time. Just because a thread exists, it doesn't mean it has anything to do, or that it'll be scheduled for execution. You can see this by looking at the changes in total CPU time for Logic/AUHostingService's constituent threads. This information isn't available in Activity Monitor, but you can see the change in total CPU time billed to each thread by running this command before/after Logic playback, and comparing the results:So, with 12+4 cores, and 36 Logic threads + 175 cores assigned to "AUHosting Service (Logic Pro)", and mainly one thread per P-core: how is this distributed?
ps vMp `pgrep Logic AUHostingService`ps vMp `pgrep Logic AUHostingService`... you can see the change in total CPU time billed to each thread by running this command before/after Logic playback, and comparing the results:
ps vMp `pgrep Logic AUHostingService`
(Note: those are backticks, not single-quotes.)
pgrep won't be able to find a PID if Logic isn't running at the time.ps vMp `pgrep Logic AUHostingService`
ps: option requires an argument -- p


